Using InventoryVerse's Analytics Dashboard provides you with an overview of your inventory in a dashboard format. This dashboard provides you with live data on sales trends, stock levels, warehouse productivity, and supply chain efficiency over a single platform, making it a very useful tool for managing inventory and understanding how your business is being affected by inventory levels.
Monitor your most critical inventory and business KPIs in real-time with beautifully designed metric cards and live data updates.
The Analytics Dashboard is InventoryVerse's centralized reporting and intelligence module that allows you to effectively manage all of your day-to-day m inventory, sales, purchases & warehouse information into insightful facts you can use right away.
You will no longer have to manually sort through piles of spreadsheets or reports that are not connected to one another because the Analytics Dashboard will automatically compile all the data 
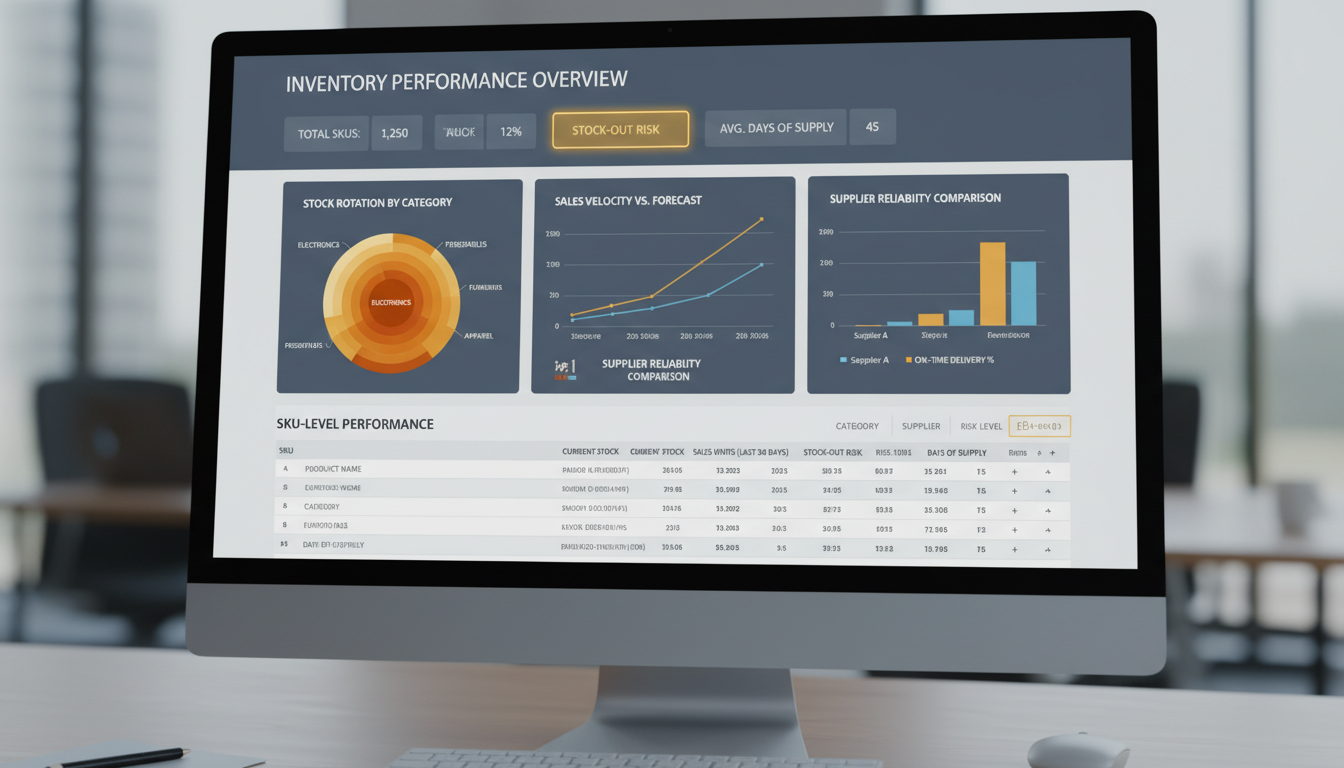
for you from every module, including the Inventory Log, Sales Management, Purchase Orders, 
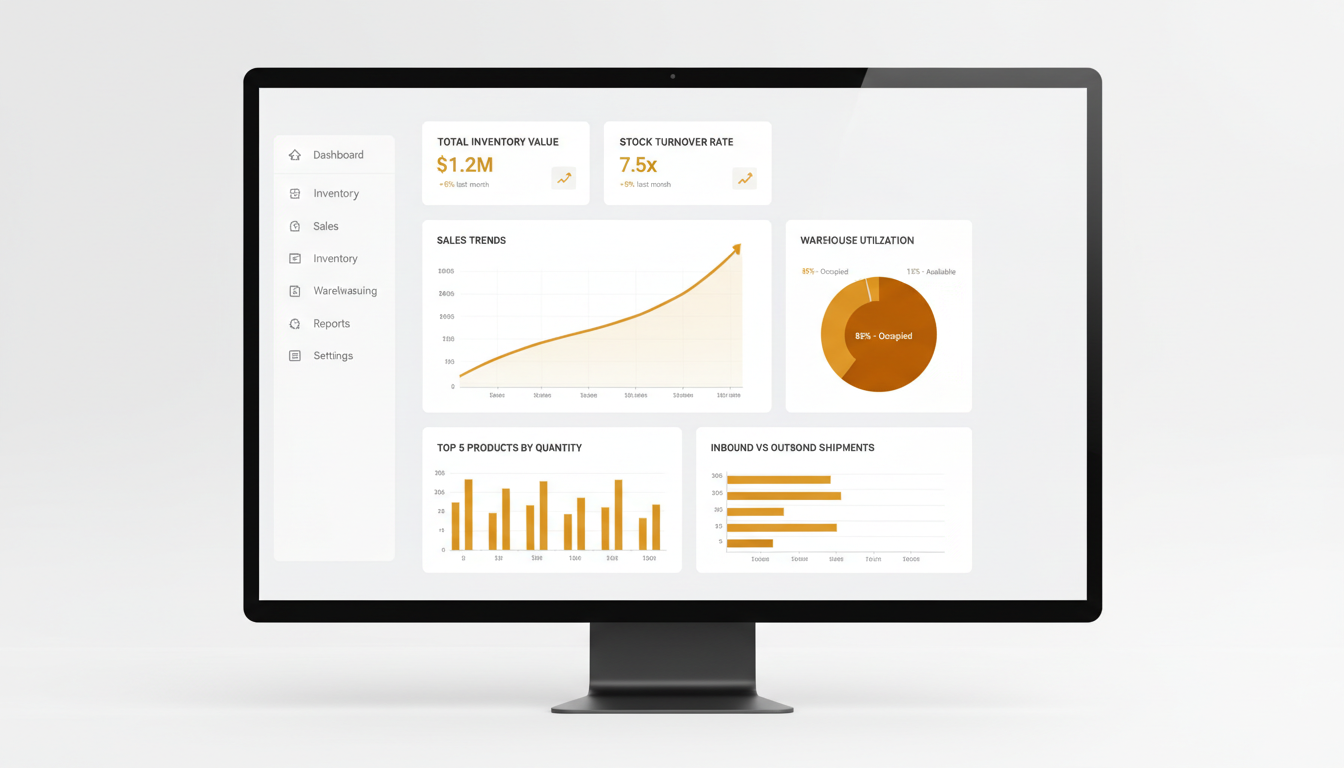
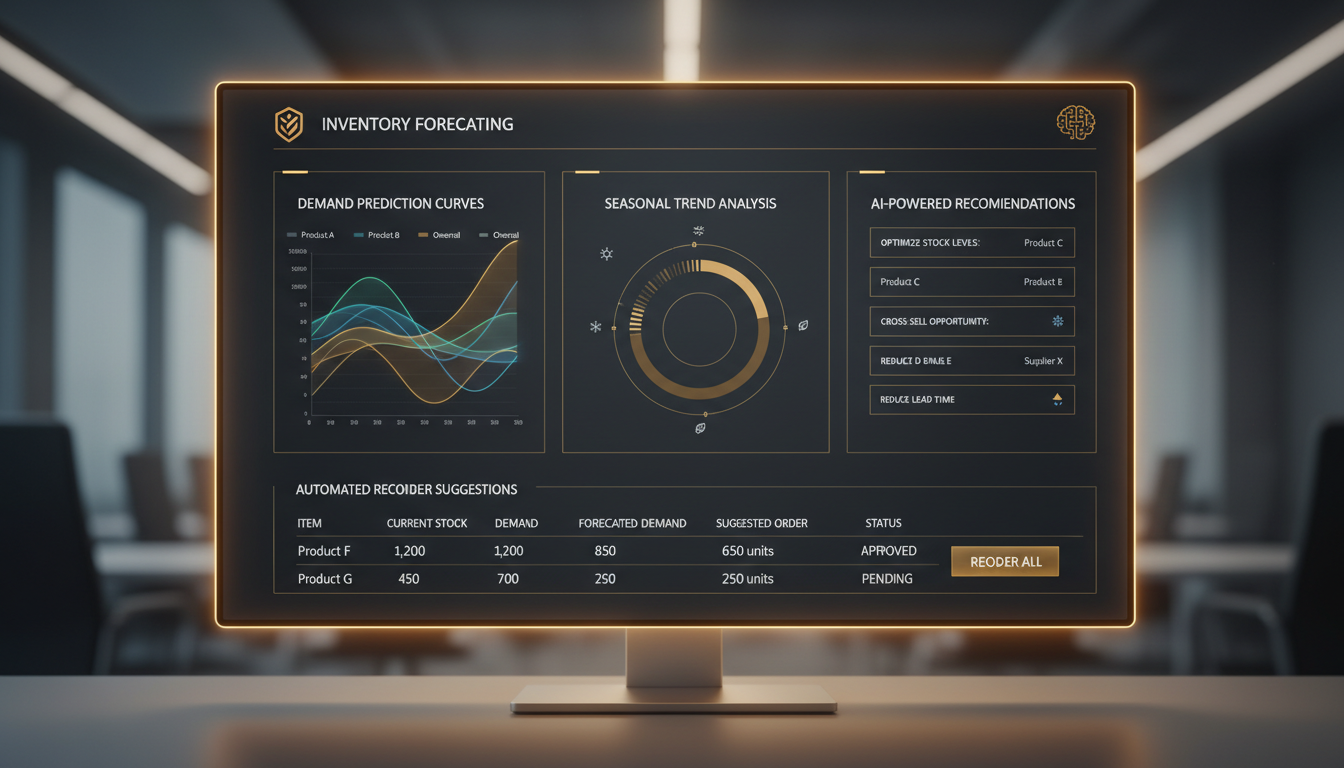
Warehouse Management, Ledger and Supply Chain. The data is made available to you in an interactive fashion using charts, graphs, heat maps and trend lines so you can easily understand what is happening within your business.
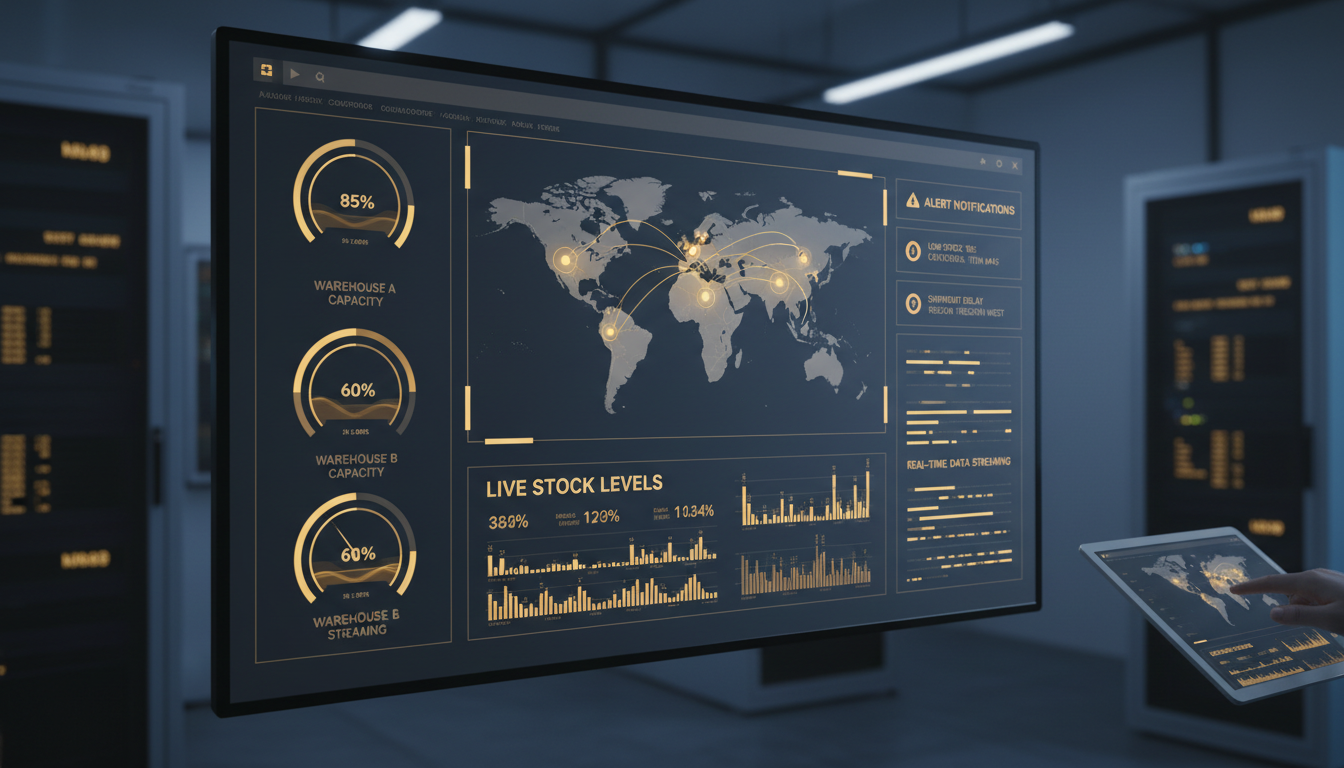
Regardless if you are the warehouse manager tracking how much product is being moved on a daily basis, or the head of finance looking at overall profitability, or the owner of a business reviewing total performance; the Analytics Dashboard provides the correct data to those individuals who need it, at the proper time, so informed and quicker decision-making can occur.
In today's fast-paced market, data-driven decisions are the difference between growth and stagnation. Here's why analytics is essential.
Immediately see all your inventory at all your locations, sales performance, and warehouse utilization through the use of real-time data. You no longer need to wait for daily, weekly, or monthly reports — you can see what’s happening right now.
Stop guessing and start using evidence to guide your decisions. Use historical data to identify and analyse trends; use the identification of a seasonality pattern to help with forecasting demand; and use historical and forecasting data together to assist with decisions around buying, pricing, and stocking.
Find discrepancies in product inventory levels and stock levels quicker than ever and prevent them from becoming a costly mistake. Use alerts and threshold monitoring to detect and prevent potential problems before they develop.
Determine which products, product categories, and warehouse facilities generate the highest profit levels. Find weak margins, under-used inventory, and excessive inventory-carrying costs to develop strategies to increase your profits through data.
Share dashboards between teams on sales, purchasing, warehouse operations, and finance so everyone has access to the same information. Each team receives a custom view of the dashboard tailored to their interests.
Produce audit reports with a full trail of data. Track every single inventory movement, financial transaction, and operational change; each event is time-stamped and assigned a user attribution.
See how InventoryVerse's Analytics Dashboard empowers your business with actionable intelligence and measurable results.
Use interactive charts to visualize how your data is changing over time or compare the different types of charts to see the data from a different view. If you click on any item in the chart (bar, line or pie), you will be able to see other details that will help you get to know that metric better.
Filter and analyze your data by any time frame, warehouse location, product type, supplier, customer, or any other custom field. Pre-set your most commonly used filter combinations as shortcut buttons so that they are easy to find later.
Set up reports to automatically generate and send to you. Daily, weekly, or monthly reports will be sent to your email address with the metrics and format you want, so that you won’t have to do any more manual work.
You can access your analytics whether you are using a desktop PC, tablet PC, or Smartphone from a responsive design; therefore, no matter what size screen you are viewing your charts and metrics, they will look good and will be interactive.
You may export any report or your dashboard as PDF, Excel, or CSV with one click. You can send specific dashboards to people's emails via secure link with them not having to log into InventoryVerse to see.
You can create your own dashboard layout by dragging and dropping widgets around. You can build which metrics, charts and tables appear on your own dashboard to match your role and priorities.
Setting up your Analytics Dashboard is quick and effortless. Start making data-driven decisions in minutes.
The Analytics Dashboard will automatically sync all your inventory, sales, purchases, and warehouses without manual imports or complicated setups from the other InventoryVerse modules.
You may select from over 50 pre-defined KPIs (metrics) or create your own from scratch. You can choose how you want the metrics presented to you (chart, graph, table, etc.) to create your personalized dashboard.
Use the interactive filter, drill-down, and compare functions to navigate your data; identify trends; uncover new business opportunities; and find hidden patterns to make better decisions.
Use insights to take action. Create automated alerts at critical thresholds; schedule recurring reports; and share dashboards to keep everyone informed and aligned.
Faster Decision Making
Reduction in Stockouts
Improved Profit Margins
Faster Report Generation
InventoryVerse Analytics Dashboard offers a comprehensive suite of reports covering every aspect of your inventory and business operations.
Summaries of inventory by stock levels, ages of stock, identification of dead stock, reorder point notifications and inventory types (FIFO, LIFO, and Weighted Average) for every item across all warehouses to provide you with total, accurate information.
Revenue understanding (revenue analysis in general), best-selling products, customer purchasing behavior, sales data by region/channel, return rates, and overall sales team performance. Clearly identify what you have sold, where you sold it, and potential buyers for complete clarity.
Supplier performance scorecards, historical purchase costs, current trends of purchasing costs, fulfillment rates of goods ordered, the timing of orders being fulfilled and a total breakdown on how much money has been spent on supplies. Complete intelligence on suppliers to assist in maximizing your purchasing decisions.
Space utilization metrics, picking/packing efficiencies, inbound/outbound volume, storage cost per unit, and forecasting of warehouse capacity based on space and resources you will utilize. Utilize data to maximize your warehouse operations.
Profit and loss by type of item and/or category of items sold, gross margin review of all sales, and an analysis of your current Account Receivables and Account Payables with estimated cash flow. Maintaining total transparency of your finances.
Complete end-to-end view of the supply chain with vendor performance for delivery of goods, cost of goods shipped via logistics, time from order to delivery of goods shipped, as well as the complete analysis of risk in the supply chain. Improve on each segment within your supply chain.
Try InventoryVerse's Analytics Dashboard — 14-day free trial, no credit card required.